Determining overhang regions are crucial for detected potential failure points for unsupported regions that are necessary to generate support structures for 3D Printing. Typically, for triangular meshes, this is calculated by taking the dot-product between the triangle normal and the vertical build direction and collecting the values across the entire mesh.
v0 = np.array([[0., 0., -1.0]])
v1 = part.geometry.face_normals
theta = np.arccos(np.clip(np.dot(v0, v1.T), -1.0, 1.0))
theta = np.degrees(theta).flatten()
The approach is not particularly complicated. However, depending on some geometries, especially those from topology optimised geometries tend to be have ‘noise’ in the surface triangles, so patches can appear within areas generally considering to require support.
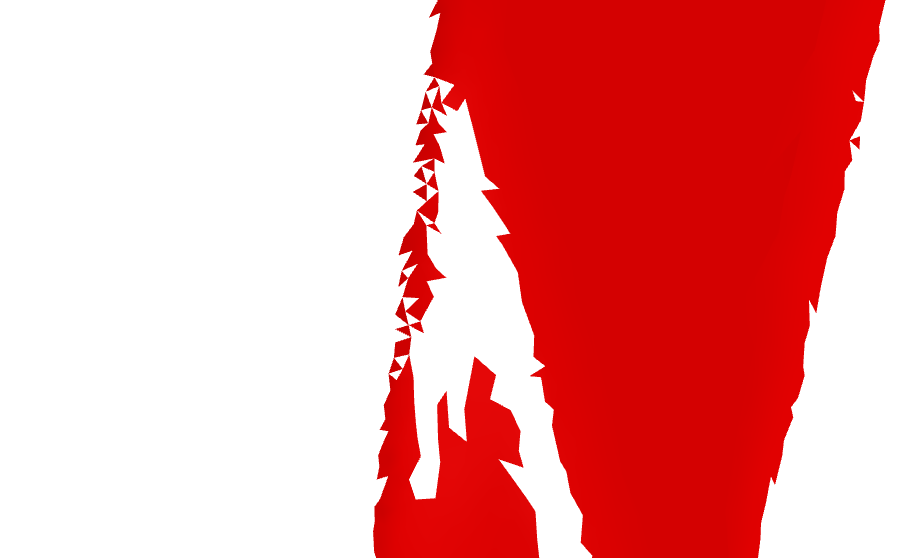
One approach taken is using the surface connectivity information to smooth or average the surface normal or overhang angle in order to reduce these discontinuities. The approach taken gathers the adjacent triangle faces and uses the information to identify the overhang angle. This option is enabled when passing the useConnectivity=true argument in pyslm.support.getOverhangMesh (will become available at a later date).
The approach uses the face adjacency information built-into Trimesh’s meshes and collects this in order to map the connectivity between faces. The list of adjacent faces are stored as a Python dict so that they can mapped on-demand.
def getAdjacentFaces(part: Part):
    mesh = part.geometry

    import networkx as nx

    graph = nx.Graph()
    graph.add_edges_from(mesh.face_adjacency)

    adjacentFaces = {node: list(graph.neighbors(node)) for node in graph.nodes}
    return adjacentFaces
Once the facial connectivity is found, each face within the mesh is iterated over. The average overhang angle is calculated accordingly by collecting the faces from the adjacency list into conFaces and then using this to index the numpy array directly.
theta = np.degrees(theta).flatten()
thetaAvg = theta.copy()
adjacencyList = getAdjacentFaces(part)
for face in adjacencyList.keys():
    conFaces = [face] + adjacencyList[face]
    thetaAvg[face] = np.mean(theta[conFaces])
The difference is highlighted below.
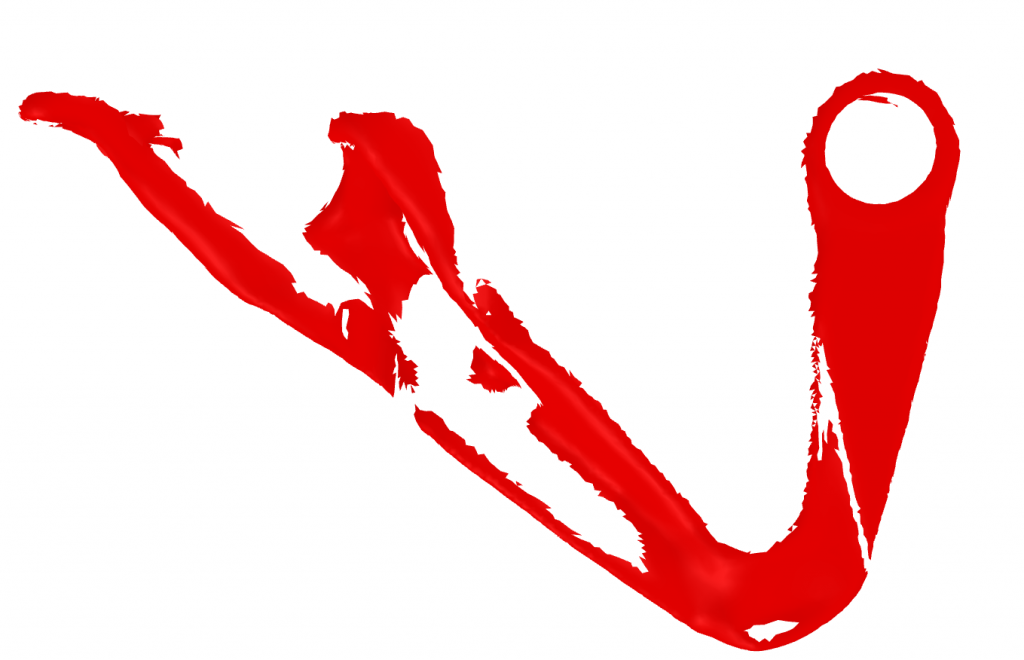
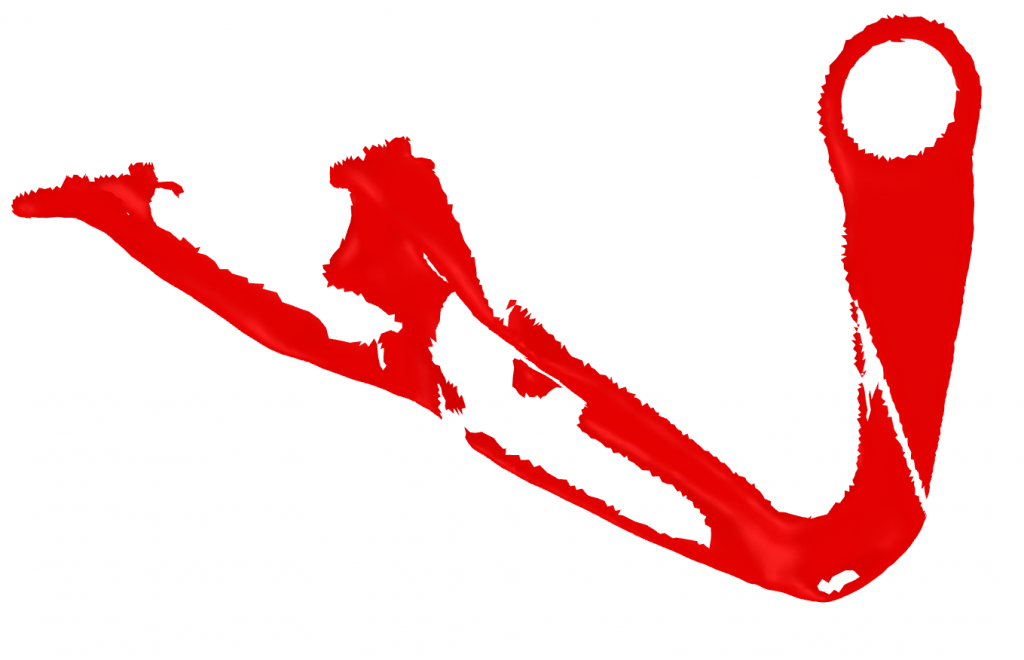
Ray Projection Investigation
The support generation – described in this post, builds upon ray projection or ‘ray casting’ method to identify intersecting support areas. The idea was looking at how one could identify supports that are only in contact with the base/build plate – typically acceptable. For reasons later explained, it can be better to work beyond the overhang regions identified based on just the triangular meshes because they can have jagged edges, even with the connectivity approach. It it also not trivial to interpolate across the surface or use polygon offsetting algorithms.
The idea is simple, rays are uniformly distributed and projected underneath the mesh to identify the intercepts with the mesh to find the distance from the build plate. The polygon of the bounding box is generated from the mesh and then is discretised with points using the rasterize function for trimesh.path.Path2D. The rays are projecting using Trimesh’s in-built ray projection facility from the seed points (note: the PyEmbree wrapper library as an auxiliary method does not provide enough accuracy to do this).
# Generate a polygon covering the part's bounding box
offsetPoly = trimesh.load_path(geometry.generatePolygonBoundingBox(mesh.bounds.reshape(2,3)))
# Rasterise the surface of overhang to generate projection points
supportArea = np.array(offsetPoly.rasterize(resolution, offsetPoly.bounds[0, :])).T
coords = np.argwhere(supportArea).astype(np.float32) * resolution
# Project upwards to intersect with the upper surface
# Set the z-coordinates for the ray origin
coords = np.insert(coords, 2, values=-1e5, axis=1)
rays = np.repeat([upVec], coords.shape[0], axis=0)
#Find the first location of any triangles which intersect with the part
hitLoc, index_ray, index_tri = mesh.ray.intersects_location(ray_origins=coords, ray_directions=rays,multiple_hits=False)
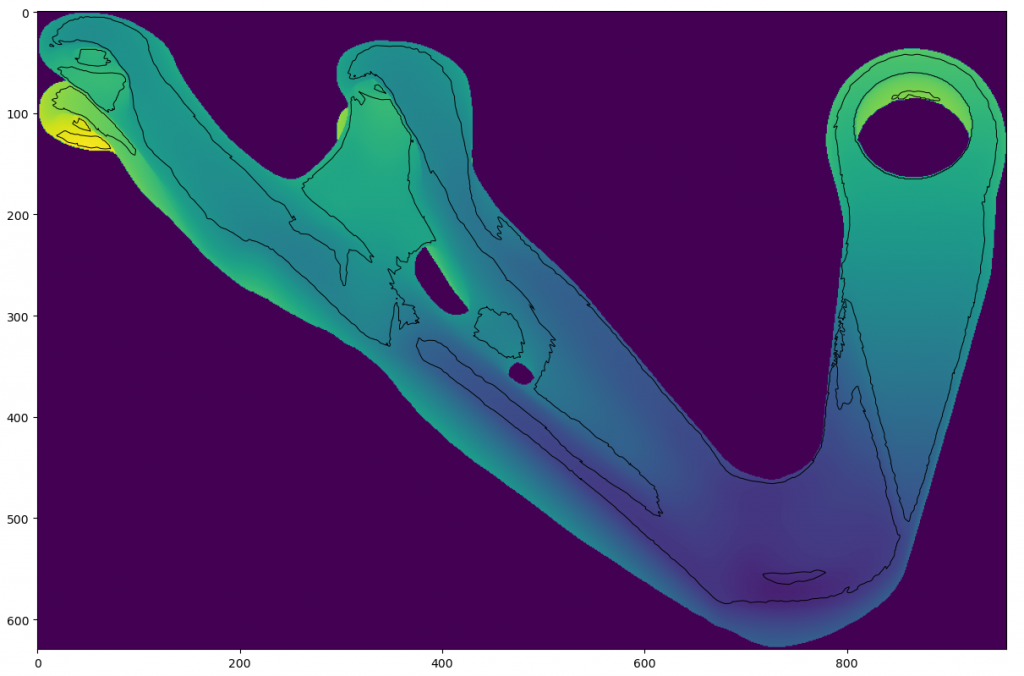
print('\t - finished projecting rays')The first hit locations with the mesh are stored and the heights are then transformed back to a height-map based on the original bounding-box and resolution used.
heightMap = np.ones(supportArea.shape) * -1.0
 if len(hitLoc) > 0:
     hitLocCpy = hitLoc.copy()
     hitLocCpy[:, :2] -= offsetPoly.bounds[0, :]
     hitLocCpy[:, :2] /= resolution
 hitLocIdx = np.ceil(hitLocCpy[:, :2]).astype(np.int32) # Assign the heights heightMap[hitLocIdx[:, 0], hitLocIdx[:, 1]] = hitLoc[:, 2]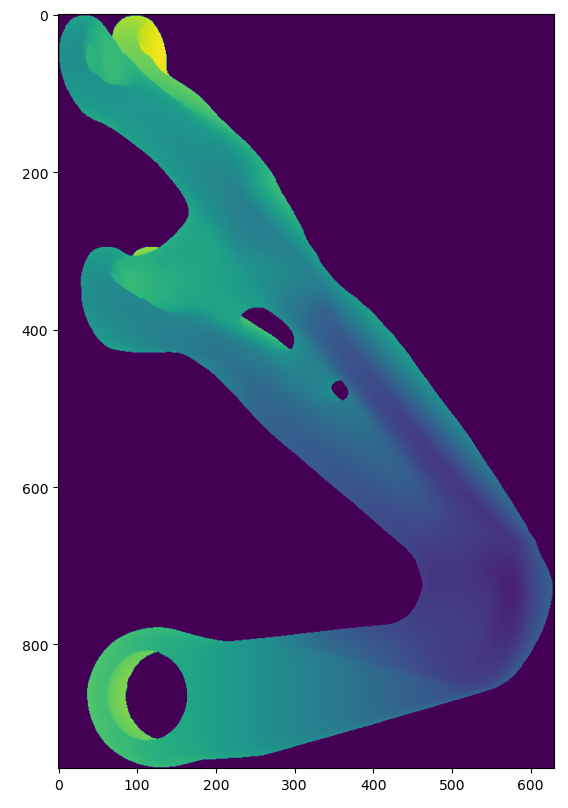
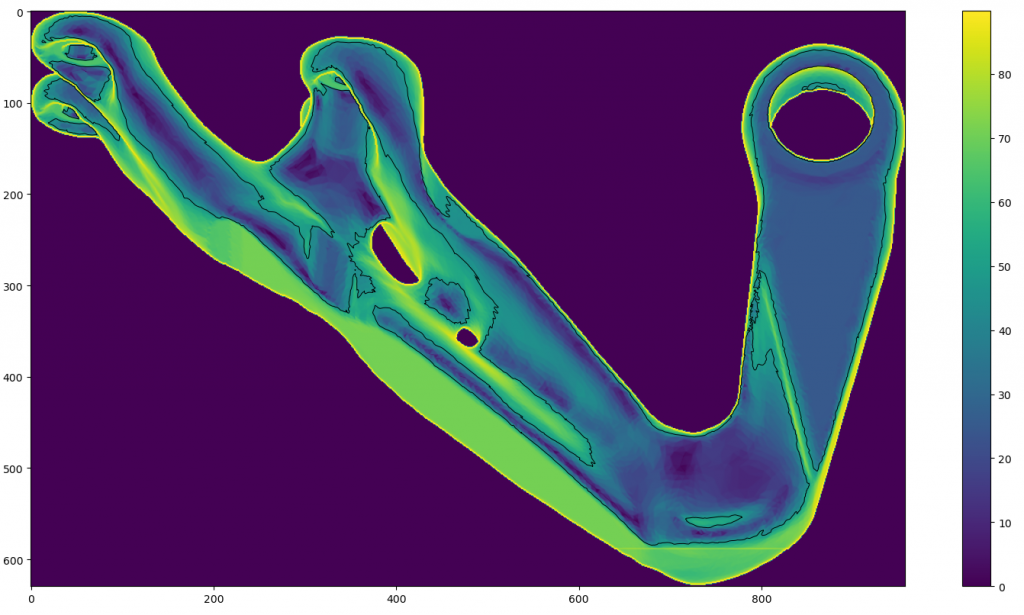
From the height map, the gradients are calculated using 1st order difference stencil within Numpy’s np.gradient function, along each direction. The magnitude is found and the overhang angle is calculated based on the resolution.
gradX = np.gradient(heightMapFix, axis=1)
gradY = np.gradient(heightMapFix, axis=0)
mag = np.hypot(gradX,gradY)
angle = np.degrees(np.arctan(mag/resolution))
Once the angle is obtained the projected overhang regions can be found using the Marching Square algorithm built into Scikit Image (skimage.measure.find_contours). The isolevel chosen is based on the overhang angle and the resolution chosen alongside some carefully selected fudge-factor. A mask is used to remove areas in the background (non-hit areas) based on the background
isolevel = 1.1 * np.tan(np.deg2rad(overhangAngle)) * resolution
contours = skimage.measure.find_contours(mag,isolevel, mask=heightMapFix>1e-3)
The result can be seen below.
The benefits of this approach are not immediately apparent. However, the contour information can be used and smoothed when projecting supports back onto the part. The limitation with the approach is that the projection’s resolution is determined by the overhang angle captured and obviously is based on the line of sight – so any self-intersecting supports with the part are neglected. The approach can be further explored using GLSL shaders in order to remove the bottleneck of ray tracing and achieve the same result.
This method is included as a utility function (pyslm.support.generateHeightMap) and both functions will be made later available with the introduction of the support module.